Table of Contents (click to expand)
Weather stations, satellites, sea buoys, commercial airliners and ships gather data from all around the world. In total, billions of observations are made every single day. Processing that data with supercomputers is essential for predicting weather in North America. Predicting imminent tornadoes and other disastrous weather events makes the difference between prosperity and ruin.
Whenever we decide to go outside our front door, we typically check the forecast for the day. We usually do this via the news or with the help of our mobile phones. This daily check helps us decide if we need an umbrella or sunglasses. The weather forecast also notifies people of certain weather events expected well into the future, so that they can prepare themselves for it. Weather forecasting has made our lives much easier, but have you ever wondered how these outlets know what the weather is going to be?
Recommended Video for you:
How Does Weather Forecasting Work?
Capturing Data From Different Sources
The answer to this timeless question of how weather forecasting works has its roots in observational data, mathematical modeling, and computation. Various sources, such as weather stations, satellites, sea buoys, commercial airliners and ships gather data from all around the world. Yes, even your commercial airplane flights are a source of data! In total, billions of observations are made every single day.
Weather forecasting using so many data points is particularly essential for predicting weather in North America, which often encounters harsh vicissitudes of weather. Particularly in the US, with its vast landmass and range of climatic conditions, it is more prone to hailstorms, flash floods and tornadoes than many other areas. The lives of fifty million people are at stake living in the coastal counties alone, which are highly susceptible to hurricanes. Predicting imminent tornadoes and other disastrous weather events early makes the difference between prosperity and ruin—between life and death!
Processing That Data With Supercomputers
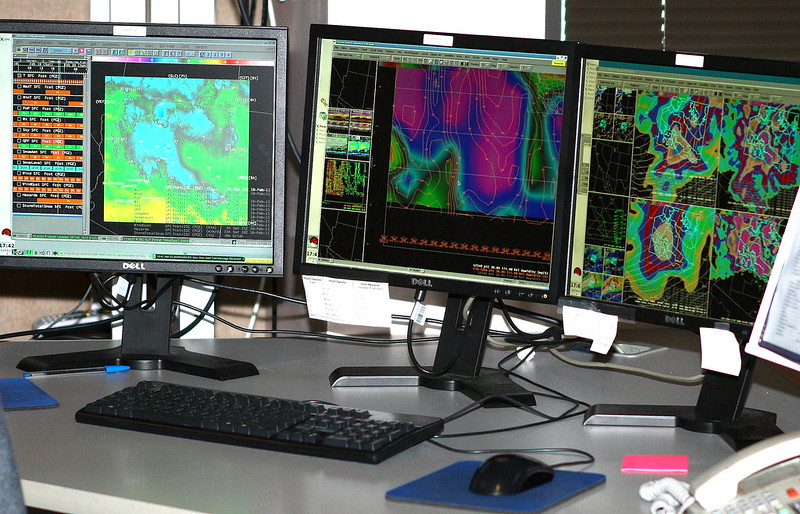
Regular PCs or the laptop we use for our day-to-day work aren’t really suited to work on the humongous amount of weather data generated from variegated instruments. Most weather agencies these days use supercomputers with amazing computational prowess. The supercomputers at the National Oceanic and Atmospheric Administration (NOAA), for example, can complete 2.8 quadrillion calculations (yes, you read that correctly. 1 Quadrillion is 1015) every second! These supercomputers have now become crucial to generating global forecasts.
Supercomputers are programmed to use mathematical models based on past weather patterns and the geography of that particular region. Mathematical models are in the form of equations that describe key processes regulating weather, such as Earth’s rotation, wind speed, and direction, precipitation, evaporation, etc. When these data points are fed from various measuring instruments and sensors to the supercomputers, they run a set of complicated equations, depending on how it’s being modeled by the meteorologist, and generates a forecast.
The models used for weather forecasting aren’t one-size-fits-all solutions; some are good at predicting hurricanes, while others are good with general temperature and humidity prediction. This is why computers don’t really have the last word. The output from them is converted into user-friendly graphs and charts, which can be then interpreted by meteorologists in the weather agency to make a more comprehensive and informed forecast.
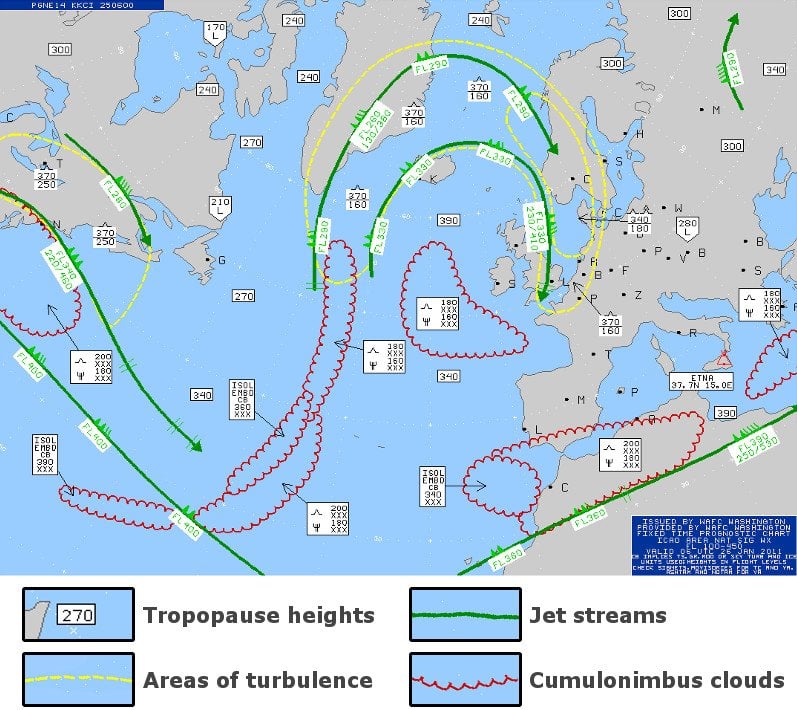
Below is an image of what a regular forecast chart looks like and how meteorologists interpret them. The yellow dashed line would represent areas of moderate or high turbulence, while the scalloped lines represent cumulonimbus clouds, which are basically thunderstorm clouds. These areas have higher chances of storms and precipitation. The green lines indicate jet streams, which are near the core of maximum winds.
What Is This Observational Data?
Meteorologists closely focus on observational data points when coming up with a weather forecast. Observational data is a list of things that affect the weather in one way or another. However, keep in mind that everything has its own significance. Let’s look into some details of these key observational data points.
Temperature And Humidity
One of the things that we observe on a day-to-day basis is temperature. An increase in temperature is most likely to cause a direct increase in evaporation. This will result in a higher amount of humidity, which increases the chances of rain, hail, or snow.
Pressure And Winds
The next two things are pressure and wind. According to the level of pressure, regions come in two types: high-pressure regions and low-pressure regions. High-pressure regions have air with high density and vice versa. As we know, things always move from high-density areas to low-density areas. Similarly, winds start flowing from high-pressure regions to low-pressure regions. The speed of that movement is decided by the difference in pressure. If the difference is large, the speed will be faster. The variation in temperature between these two regions also has notable effects, leading to regular rainfall/snowfall, or in some cases, thunderstorms/tornadoes.
Dew Point
If you observe a glass of cold water in the sun or the morning grass on your lawn, you can clearly see water droplets present. These drops of water are called ‘dew’ or condensation. When the temperature is low enough, the air becomes saturated with water vapor. At that point, we start to see water appear on the surface of glasses or windows. The temperature at which this event occurs is called the ‘dew point’. Thus, on any given day, if the temperature and dew point are close, it leads to a higher amount of water vapor. A higher amount of water vapor leads to higher humidity, which further affects the weather, as mentioned above.

Who Conducts This Weather Forecasting?
Many countries rely on a single weather service provider, which is often federally controlled, for weather prediction, warnings, and alerts. However, in the US, there are public, private, and university-based weather forecasting systems.
The US, being a large and populous country dealing with wide fluctuations in weather conditions across the vast landmass, probably needs multiple agencies specializing in different niches for a more accurate forecast. The US is regarded as one of the global powerhouses of weather forecasting.
Most forecasts come from the National Centers for Environmental Prediction (NCEP), which is a part of the federal weather forecasting agency—National Weather Service (NWS). The NCEP runs various weather models and passes on the results of this modeling to the NWS office, which then customizes and optimizes the forecast based on the region.
As mentioned earlier, there are also private weather forecasting agencies in the business of weather forecasting. For example, commercial weather service provider Weather Underground optimizes the official forecast generated by NWS for a neighborhood scale by overlaying information it gets from its own network of weather stations. Commercial players like Weather Underground help in getting more accurate weather forecasts in your locality. Thus, different commercial weather service providers have their own niche. Some provide accurate local weather forecasting, and some specialize in providing a forecast of climatic catastrophes like thunderstorms or floods.
How Accurate Are Weather Forecasts?
You might have heard a joke that weather forecasting is the only occupation where you can be wrong half the time and still not lose your job! Is weather forecasting really that inconsistent? Despite the jokes, that’s not really the case.
Over the years, the techniques used in weather forecasting have improved by leaps and bounds. The present weather forecasting systems are much more accurate than those in the 80s or 90s.
According to the National Oceanic and Atmospheric Administration (NOAA), five-day forecast predictions by weather agencies now has a 90% accuracy. Seven-day forecasts are around 80% accurate. These statistics become much more impressive upon comparing with historical data. For instance, today’s five-day hurricane forecast is more accurate than four-day forecasts in the early 2000s and much more accurate than three-day forecast in the early 1990s.
Although the forecast accuracy has improved significantly over the years, meteorologists are always targeted when the weather prediction goes wrong once in a while. Also, with the advent of social media, weather data are sometimes represented out of context, which gives the impression that the weather forecast department does a shoddy job. Someone has rightly said that “meteorologists are like goalkeepers; no matter how many saves they make, they’ll only be remembered for the ones they miss!”
Meteorologists admit that weather forecasting still isn’t an exact science. Analyzing a multitude of factors can be difficult to perfectly model for computers. Perhaps that’s the beauty of weather, that even now, with all our supercomputers, it still keeps humans guessing about its tantrums!
Due to advances in research and the usage of artificial intelligence, weather forecasting is improving significantly. According to Richard Anthes, the president of the University Corporation for Atmospheric Research, a few years from now, the weather forecast will be essentially perfect for a zero to two-day timeframe. Well, if we can achieve that, we can be completely sure about the weather’s behavior for at least a day or two, and could better plan our trips and outings without any worries of a forecast going terribly wrong!
References (click to expand)
- Predicting Weather - Seo Title. ussartf.org
- Judt, F. (2020, January). Atmospheric Predictability of the Tropics, Middle Latitudes, and Polar Regions Explored through Global Storm-Resolving Simulations. Journal of the Atmospheric Sciences. American Meteorological Society.
- Judt, F., & Chen, S. S. (2016, November). Predictability and Dynamics of Tropical Cyclone Rapid Intensification Deduced from High-Resolution Stochastic Ensembles. Monthly Weather Review. American Meteorological Society.
- Improving weather forecasts - NOAA. The National Oceanic and Atmospheric Administration


